


Start Scientific Inquiry With a Testable Question
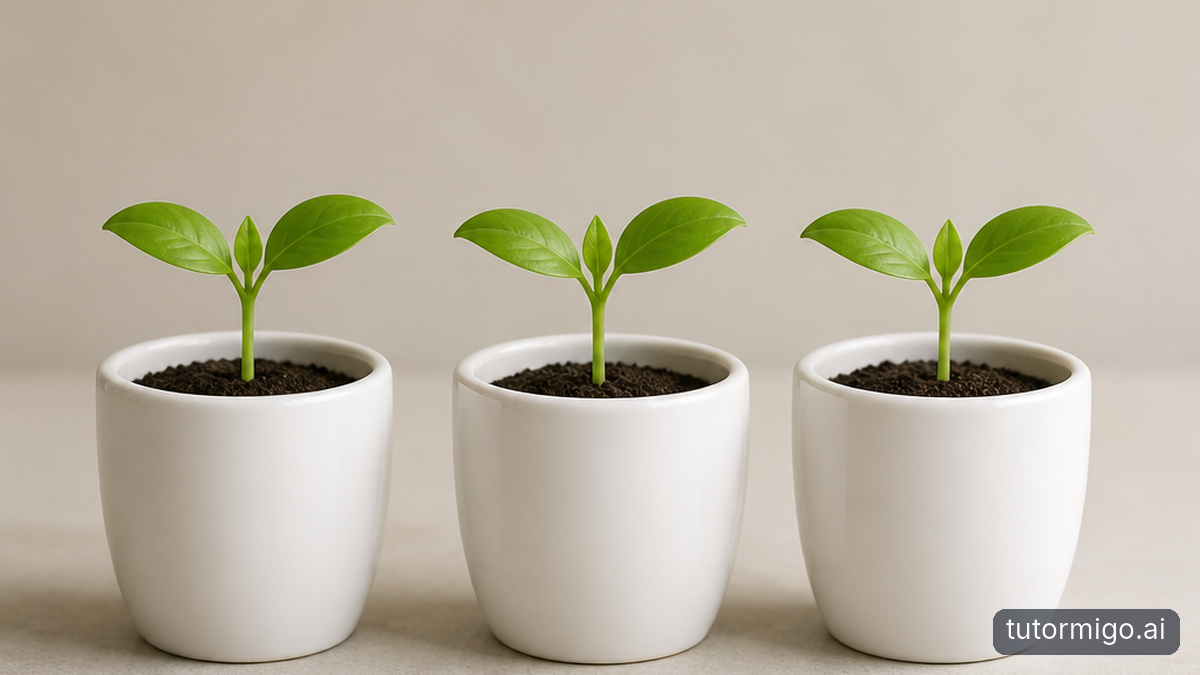
When a science investigation produces a neat answer too quickly, the real inquiry may have been skipped. Fostering scientific inquiry: building empirical hypothesis begins with helping students turn curiosity into a question that evidence can answer. “Which paper towel is best?” is a useful starting point, but “How does the number of layers affect the mass of water absorbed in 30 seconds?” gives the investigation something measurable to examine.
Ask learners to identify the variable they will change, the outcome they will measure, and the conditions they will keep the same. In a plant investigation, they might change the amount of light while keeping plant type, soil, pot size, and watering schedule consistent. This makes the question narrower without making it less interesting.
A strong hypothesis should predict a result and give a reason. “If a plant receives more light, then it will gain more height over two weeks because light supports photosynthesis” can be checked against observations. It can also be revised. Treat that revision as part of scientific work, not as evidence that the original thinker failed.
Make Hypotheses Specific and Falsifiable
A hypothesis is more useful when you can imagine evidence that would show it is unsupported. “Temperature affects dissolving” is too broad to guide a fair test. “Sugar will dissolve faster in warm water than in cold water when the volume, sugar mass, and stirring time are the same” identifies a comparison and conditions that another group could repeat.
Before collecting data, ask students to write down what result would support the prediction and what result would challenge it. This simple step protects against changing the hypothesis after seeing the outcome. If warm water dissolves the sugar faster, the result is consistent with the prediction. If the times are similar, the hypothesis needs qualification or rejection; it should not be quietly rewritten.
You can make the reasoning visible with a three-part statement: because names the mechanism, if states the test condition, and then predicts the observation. For younger learners, drawings and sentence frames work well. Older students can specify a measurable difference, such as a predicted time or range, while acknowledging that real measurements contain variation.
Tip: Ask, “What observation would convince you that your prediction is wrong?” A thoughtful answer often reveals more scientific reasoning than a confident prediction.
Design a Fair Investigation
Good data depends on good design. Have learners map an investigation before they begin: identify the independent variable, dependent variable, controlled conditions, number of trials, and measurement method. In a paper-airplane test, for example, the design might hold paper size and launch height constant while comparing flight distance across three plane designs.
Repeating trials matters because one unusual result can distort a conclusion. If one airplane travels 4 meters, 4.2 meters, and 7.8 meters, the last measurement deserves attention rather than automatic removal. Was the launch different? Did the plane hit a draft? Was the measuring tape aligned correctly? Students should record the observation and investigate its cause before deciding whether the trial was valid.
Measurement choices also shape the evidence. A ruler may be suitable for length, while a stopwatch introduces reaction-time differences. A balance that reads to the nearest gram cannot support claims about changes of a few milligrams. Encourage learners to note units, instrument precision, timing rules, and any departure from the original procedure.
Ethical and practical limits belong in the design too. Investigations involving people, animals, heat, electricity, or unknown substances require appropriate supervision and safety controls. A scientifically interesting question is not automatically a safe experiment.
Turn Measurements Into Evidence
Raw measurements are a record, not yet an explanation. First, students should organize observations in a table with clear headings, units, and trial labels. Next, choose a display that matches the question. A line graph can show change over time, a bar chart can compare categories, and a scatter plot can show whether two measured variables move together.
Have learners describe the pattern before interpreting it. “The seedlings exposed to eight hours of light grew an average of 3 centimeters, while those exposed to four hours grew 1.5 centimeters” is an observation. “More light caused the seedlings to grow faster” is a claim that requires attention to other conditions. The distinction helps students avoid treating a visual pattern as proof of a single cause.
Central tendency can summarize repeated measurements, but a single average can hide important variation. Two groups may have the same average height while one group is tightly clustered and the other includes very small and very large plants. Ask students to report the spread in plain language, compare individual trials, and identify results that do not fit the overall pattern.
Graphs should also be checked for misleading choices. A truncated vertical axis can make a small difference look dramatic, while uneven intervals can distort the visual story. Require a descriptive title, labeled axes, units, and a legend when more than one group appears.
Interpret Results Without Overclaiming
Data interpretation becomes stronger when students separate three moves: describe the evidence, explain what it may mean, and state the limits of the conclusion. Suppose bean plants given fertilizer grow taller than untreated plants after three weeks. The evidence supports a difference in this investigation. It does not automatically establish that every fertilizer, plant variety, soil, or growing condition will produce the same result.
Use comparison questions to slow down premature conclusions. How large is the difference relative to the variation within each group? Did every trial show the same direction? Were there enough repeated measurements to make the pattern persuasive? Could another factor, such as uneven watering or a warmer location, explain the result?
Correlation needs the same caution. If students observe that taller children tend to have larger shoe sizes, they can describe an association, but shoe size does not cause height. A third factor—age or overall growth—may influence both. Asking “What else could explain this pattern?” is a practical way to introduce alternative explanations without turning the investigation into a vocabulary exercise.
Invite students to write conclusions using evidence and uncertainty: “The results suggest...” is sometimes more accurate than “The results prove...” Scientific confidence should track the quality of the design, the consistency of the measurements, and the strength of competing explanations.
Revise the Investigation and Claim
Inquiry does not end when the graph is finished. The next step is to decide what should happen to the question, procedure, or claim. If a sound investigation produces mixed results, students can propose a follow-up test that changes one design feature at a time. For the plant example, they might increase the number of plants, rotate pot positions, extend the observation period, or measure leaf count as well as height.
Require a specific revision rather than a general statement such as “do more research.” A useful reflection identifies a limitation, explains how it could affect the result, and proposes a concrete response. “The lamp was closer to one side of the tray, so future trials will rotate the pots each day” connects a design problem to an action.
Students should also compare their findings with other groups without treating disagreement as a competition. Different results may reveal uncontrolled variables, measurement differences, or a hypothesis that works only under certain conditions. Ask groups to share one result they trust, one result they question, and one piece of evidence they need next.
The most durable scientific habit is willingness to update a claim when evidence changes. Give learners permission to say, “Our data did not answer the question yet.” That conclusion is not an escape from inquiry; it is an accurate interpretation of what the investigation can support.
Frequently asked questions
An empirical hypothesis makes a prediction that can be examined through observations or measurements. It must identify evidence that could support, challenge, or refine the prediction.
Ask them to report what they directly measured or saw first, then explain the pattern. Measurements are observations; statements about causes or meaning are conclusions that require evidence.
Repeated trials help reveal ordinary variation and reduce the influence of an unusual result. They also give students more evidence for judging whether a pattern is consistent.
They should report the result honestly, consider limitations or alternative explanations, and propose a focused follow-up investigation. A revised claim can be a successful outcome of inquiry.
Related reading
Related reading
Related reading
Interpret Results Without Overclaiming
How large is the difference between the groups, and how consistent are the measurements? A fertilizer treatment that produces plants 1 centimeter taller on average may matter less than a treatment that produces a 10-centimeter difference, but size alone does not settle the question. Students should consider the starting heights, the spread of the results, and whether the difference is larger than the variation they observed.
Next, ask what else could explain the pattern. Perhaps the fertilized plants received more water because their pots were placed closer to the watering station. Perhaps the untreated plants were shaded for part of the experiment. A useful conclusion names the conditions instead of making a universal claim: “Under the soil, light, and watering conditions in this investigation, the fertilized bean plants grew taller after three weeks.”
This wording is not timid. It is precise. Encourage learners to distinguish between what their data directly shows and what they infer from it. They can then identify what a new investigation would need to test, such as using several plant varieties or repeating the experiment with a different fertilizer concentration.
Use Uncertainty as Part of the Evidence
Measurements are never perfectly exact. A student timing how long a tablet takes to dissolve may start or stop a stopwatch slightly late. A ruler may make it difficult to decide whether a plant is 12.4 or 12.5 centimeters tall. Rather than hiding these limits, have students describe how they could affect the conclusion. If two groups differ by only a small amount, timing uncertainty may make the apparent difference less convincing.
Teach learners to look for repeated patterns rather than demanding identical results. In a bouncing-ball investigation, heights of 82, 79, and 81 centimeters suggest a fairly consistent result, while 82, 61, and 95 centimeters raise questions about the procedure or the measuring method. The unusual values should be examined, not erased simply because they are inconvenient.
A helpful sentence frame is: “The results suggest ___, but confidence is limited because ___.” For example, “The rough surface may reduce the ball’s bounce, but confidence is limited because the release height was not measured precisely.” This language gives students a way to be honest about uncertainty while still making a useful evidence-based statement.
Tip: Ask learners to circle the part of their conclusion that is most certain and underline the part that depends on an assumption. Then ask what additional observation could strengthen the weaker part.
Build a Claim From Evidence and Reasoning
A conclusion becomes clearer when students separate three parts: the claim they are making, the evidence that supports it, and the reasoning that connects the two. In a paper-airplane test, the claim might be that Design B flew farthest under the tested conditions. The evidence could include the three recorded distances for each design and the average distance for each group. The reasoning explains why those measurements justify the comparison.
Ask learners to avoid evidence that is too narrow. One successful trial does not establish that a design is best. They should refer to the full set of trials and mention relevant variation. They should also explain whether the test was fair: Were the planes launched from the same height? Did the same person release them? Was the measuring method consistent?
When students present their conclusions, require them to include one limitation and one next step. A limitation might be that only one type of paper was tested. A next step might compare the designs using heavier paper while keeping launch height and folding method consistent. This structure makes scientific communication more than a declaration of who was right. It shows how the evidence supports a claim and how the investigation could become stronger.
For help separating main ideas from supporting details, students can also use strategies from this guide to turn long content into simple summaries.
Revise Explanations Instead of Defending Them
Scientific thinking develops when learners treat an explanation as something that can improve. If the results do not support the original hypothesis, do not ask only, “What went wrong?” Ask, “What does this result help us understand?” A sugar-dissolving experiment may show little difference between warm and room-temperature water because the temperature gap was too small, the stirring was inconsistent, or the timing method was too imprecise.
Have students compare the original prediction with the actual pattern in a two-column record. In the first column, they state what they expected and why. In the second, they describe what happened and identify the most important difference. They can then write a revised explanation without pretending that the first prediction was never made.
Revision should be based on evidence, not on the desire to obtain a preferred answer. If one trial conflicts with the others, students should investigate the procedure before changing the explanation. If all trials show the same unexpected pattern, the hypothesis may need genuine revision. This process also supports productive discussion: a learner can disagree with a conclusion while still recognizing that the conclusion follows reasonably from the available data.
Reflection questions such as “Which part of the design would you change?” and “What result would you expect next time?” turn an ending into the beginning of a better investigation.
Communicate Findings So Others Can Evaluate Them
A strong investigation should be understandable to someone who did not participate in it. Ask students to describe the question, hypothesis, variables, procedure, results, conclusion, and limitations in that order. They do not need to make the report complicated. A clear table, an accurately labeled graph, and a short explanation often communicate more than a crowded page of decoration.
Details that seem minor can determine whether another person can evaluate the work. Include units, the number of trials, the timing rule, the measurement tool, and any change made during the procedure. If a group moved its experiment indoors because of rain, that change belongs in the report. It may help explain why the results differ from an earlier class investigation.
Peer review can focus on reasoning rather than grammar. Give reviewers three questions: What claim is being made? Which evidence supports it? What limitation or alternative explanation should be considered? Students can then revise one paragraph or one graph based on the feedback. This makes communication part of inquiry, not a final formatting task.
Clear explanations also strengthen the move from confusion to clarity because learners must show how each observation connects to the conclusion.
Plan the Next Test With a Sharper Question
End an investigation by asking what it has made you curious about now. If more light was associated with taller seedlings, the next question might compare several light levels rather than simply “more” and “less.” If a paper airplane flew farther, students might test whether wing width or nose shape accounts for the difference. The next question should change one important feature while preserving the conditions that made the first comparison fair.
Before starting again, have learners predict how the new result might differ and identify what would count as evidence against that prediction. They should also decide whether the measurement method is sensitive enough. If the expected change is small, measuring to the nearest centimeter may not be sufficient. A more precise tool, longer observation period, or greater number of trials may be needed.
The goal is not to produce a perfect answer in one attempt. It is to build a chain of questions, measurements, explanations, and revisions. Students who learn to follow that chain become less dependent on being told the correct conclusion and more capable of judging whether a conclusion is earned.
When a learner wants guided practice with organizing questions, evidence, and follow-up reasoning, TutorMigo.ai can provide a personal workspace for working through a topic step by step. Use it as support for thinking, while keeping the investigation, measurements, and conclusions grounded in the learner’s own evidence.
Related reading
Related reading
Enjoyed this read?
Like, share, or comment below.



Comments
0Sign in required · respectful discussion · replies supported
Loading comments…