


Why STEM Text Walls Make Visual Learning Feel Impossible
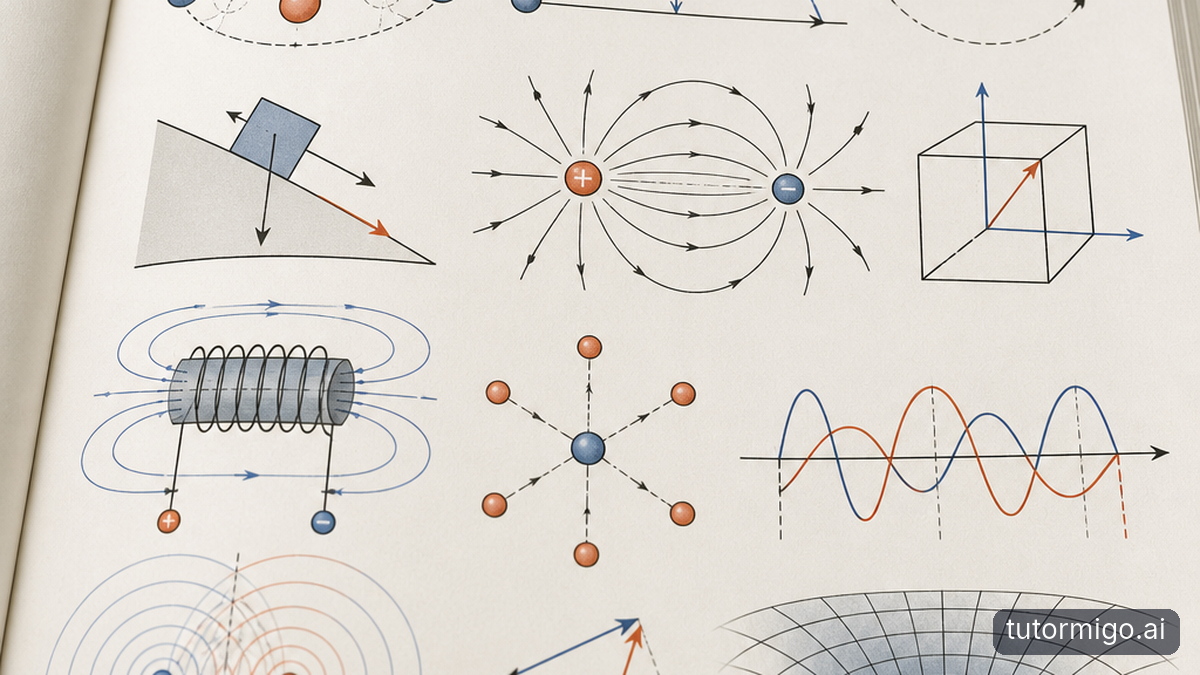
A page packed with definitions, paragraphs, symbols, and worked examples can make you feel lost before you begin. If you learn best through images, that reaction is not laziness or a lack of ability. Your working memory may be trying to hold the vocabulary, sequence, diagram, and underlying idea at the same time. Start by shrinking the visual task. Cover everything except one paragraph, then ask: “What is this part trying to show?” For a forces lesson, you might circle the object, underline the change in motion, and draw one arrow before reading the next line. The goal is not to decorate notes. It is to give each idea a visible shape. If this pattern happens repeatedly, it may help to read more about why text-heavy explanations can fail visual STEM learners.
Turn paragraphs into a visual sequence
Treat a STEM explanation like a process map rather than a wall of prose. Read one small chunk, then convert it into one of three forms: a labeled sketch, a cause-and-effect chain, or a before-and-after picture. In biology, a paragraph about gas exchange can become a simple path showing air moving into the lungs and oxygen moving into the blood. In chemistry, describe a reaction with three boxes: what you start with, what changes, and what you observe. Keep labels short and use the same color for connected ideas. After each section, close the book and redraw the sequence from memory. If you cannot, reopen only long enough to find the missing link. This method exposes the exact point of confusion instead of making you reread an entire chapter without a clear target.
Use worked examples without copying blindly
Worked examples often look helpful but become another text wall when every line feels equally important. Separate the example into four visual zones: the question, the known information, the operation or decision, and the result. For a motion problem, put the given measurements in one box, sketch the situation beside it, and write one sentence explaining why the next step makes sense. Then cover the solution and predict what should happen before revealing the next line. A mistake becomes useful when you mark its location: misunderstood diagram, missing definition, incorrect operation, or arithmetic slip. Ask yourself to explain the example using a sketch and a few spoken sentences, not by reciting the page. You can also compare this approach with strategies for getting unstuck during a difficult math problem.
Build a repeatable visual study routine
Visual support works best as a routine, not a last-minute rescue. Begin with a two-minute preview: scan headings, diagrams, captions, and bold terms, then predict how the ideas connect. Study for fifteen minutes with one output in mind, such as a concept map or annotated diagram. Spend the final three minutes hiding your notes and reconstructing the main path from memory. On the next day, redraw the same idea more quickly and add only what you forgot. If you are a parent or teacher, ask for a demonstration rather than a definition: “Show me what changes first,” or “Draw the system before you explain it.” If you are studying alone, an ai.tutor can be a reasonable next step when you want guided questioning that helps turn dense STEM material into a sequence you can see and explain. TutorMigo.ai is one option to explore when that kind of support would make independent practice easier.
Frequently asked questions
No. Textbooks can still provide precise explanations, but you may understand them better when you convert each small section into a sketch, sequence, diagram, or concept map.
Draw only what clarifies the relationship. A simple labeled sketch, timeline, flowchart, or before-and-after picture is usually more useful than detailed artwork.
Separate the example into the question, known information, decision or operation, and result. Then identify whether the problem is the diagram, vocabulary, reasoning step, or calculation.
Close the book and explain or redraw the idea from memory. If you can show the sequence and identify where each part connects, the method is improving understanding rather than merely making notes look organized.
Choose Color With a Purpose
Color can make a STEM text wall easier to scan, but random highlighting quickly becomes visual noise. Assign one color to definitions, another to causes or mechanisms, and a third to evidence, formulas, or examples. Keep the same color system across pages so your eyes learn what to expect. Use bold outlines, underlining, or symbols when color contrast is limited. The goal is not to decorate the wall; it is to create a visual code that makes relationships visible.
Design for Accessibility
A useful visual system should remain understandable without relying on color, tiny type, or crowded layouts. Pair colors with labels, icons, line styles, or short annotations. Leave generous space between clusters, use readable fonts, and place related items close together. If a diagram becomes difficult to read, split it into smaller views rather than shrinking everything. Good visual learning reduces unnecessary effort so attention can stay on the scientific idea.
Use Retrieval Prompts
Add small questions beside major concepts, such as “What causes this change?” or “Which evidence supports this claim?” Cover the answers and respond from memory before checking the wall. These prompts turn a display from a passive reference into an active practice tool. Change or rotate the questions as your understanding develops.
Related reading
Enjoyed this read?
Like, share, or comment below.


Comments
0Sign in required · respectful discussion · replies supported
Loading comments…