

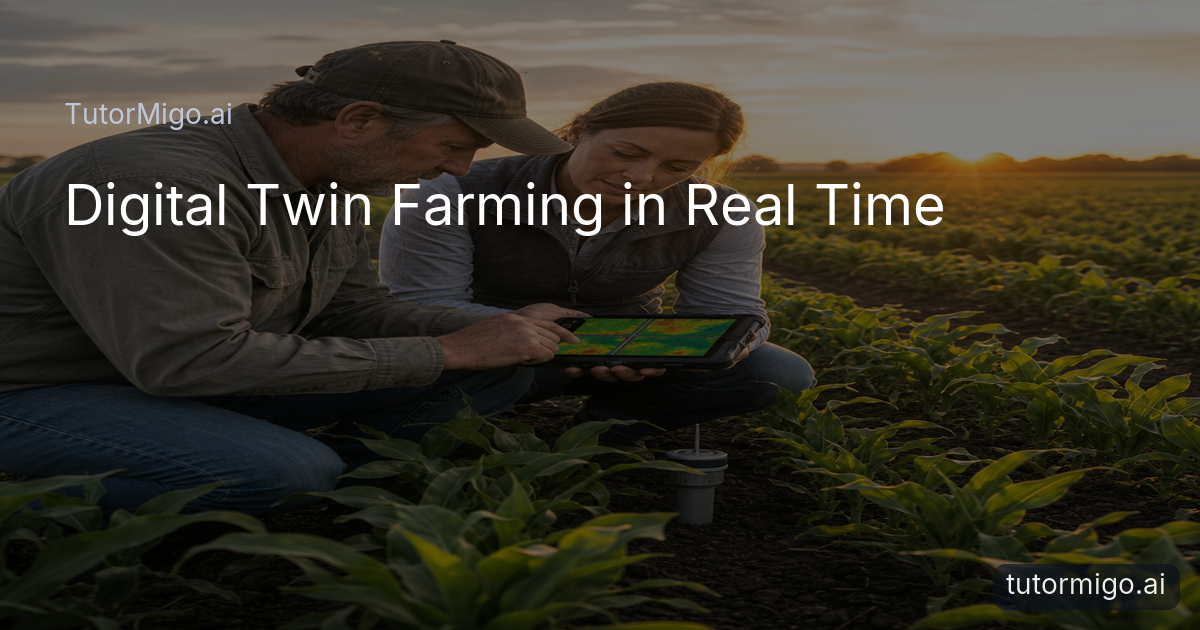
Why farmers are building digital twins
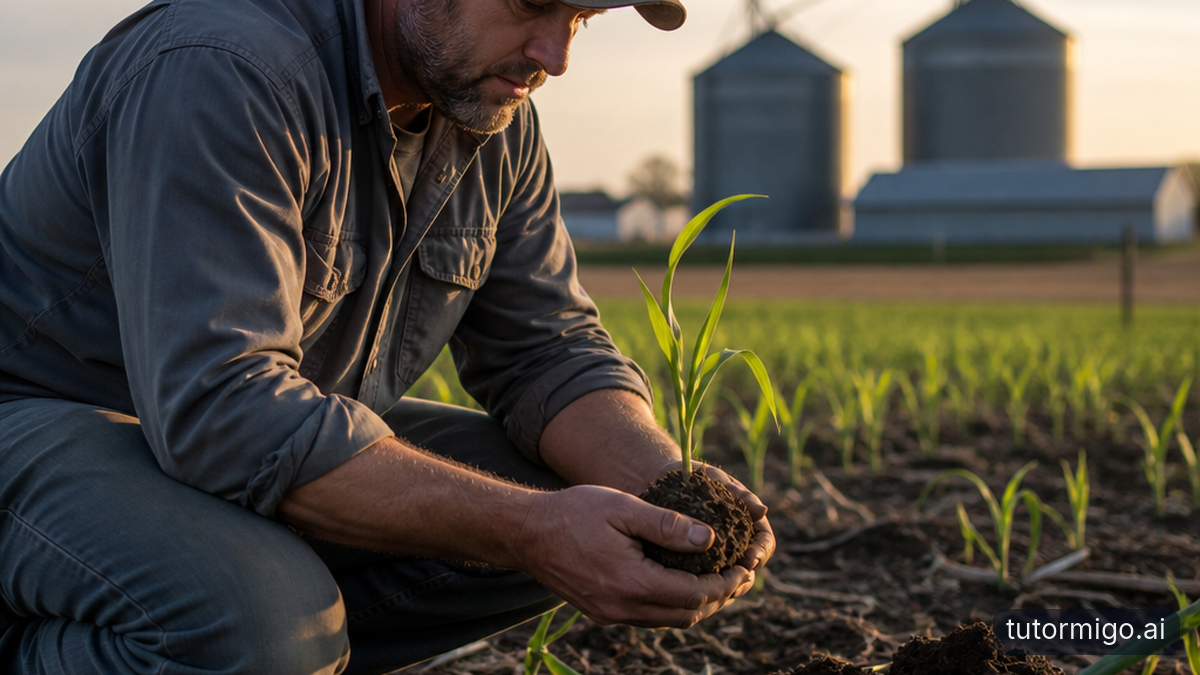
When a field starts drying unevenly, showing early signs of stress, or receiving more fertilizer than the crop can use, you need to decide before the damage becomes visible. Digital twin farming: simulating real-time field conditions gives you a way to test those decisions virtually first. A digital twin is a working digital representation of a physical field, linked to observations from sensors, machinery, satellites, weather services, and crop inspections.
The twin is not simply a map or a dashboard. It combines a field’s boundaries, soil zones, drainage patterns, planting dates, crop varieties, and management history with changing measurements. If soil moisture drops in one section after several hot days, the model can update that section without treating the whole farm as identical.
That distinction matters because agricultural decisions are local. Two plots less than a mile apart may have different soil texture or elevation and therefore need different irrigation timing. A useful twin helps you compare likely outcomes before driving a tractor, opening a valve, or applying a product. It supports judgment rather than replacing the people who know the land.
The data foundation: sensors, maps, and context
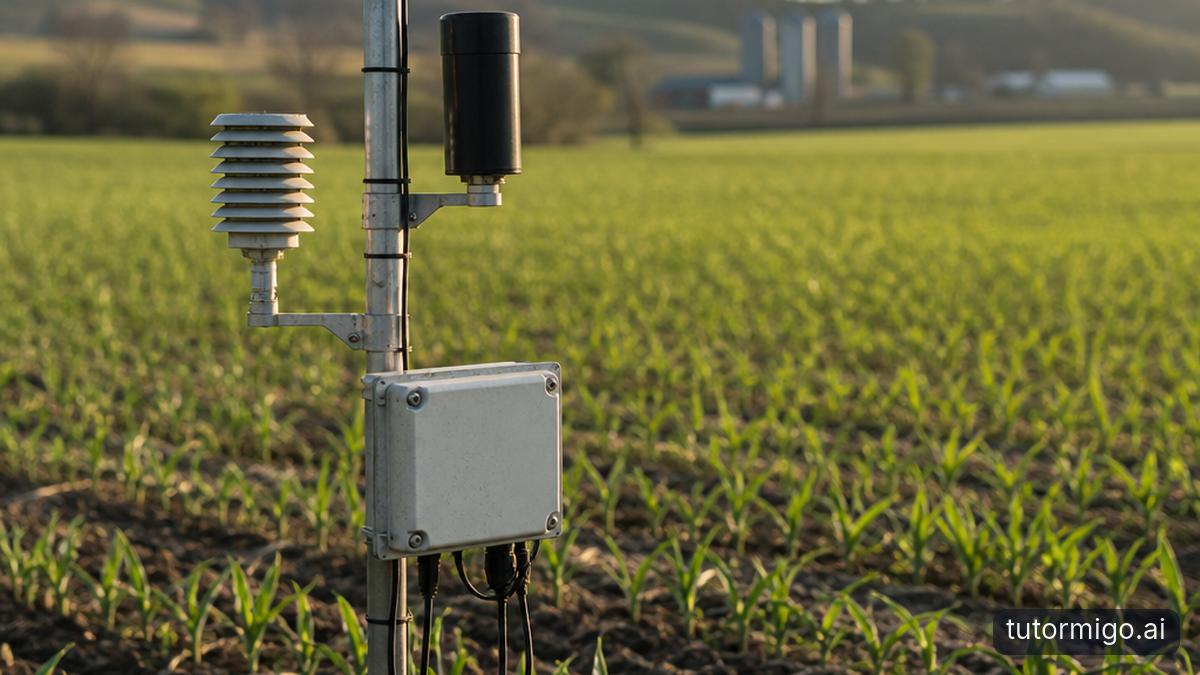
A digital twin is only as useful as the information feeding it. Soil-moisture probes can report conditions at selected depths, while weather stations capture temperature, rainfall, wind, and humidity. Equipment telemetry may show planting depth, speed, spray rate, or irrigation volume. Satellite and drone imagery can add a broader view of canopy development and unusual color patterns.
Each source answers a different question. A probe may tell you that water is limited below the surface; imagery may show that the crop canopy is thinner in the same zone. A field boundary and elevation map help explain where runoff collects. Planting records and soil tests add context that a sensor cannot infer on its own.
Before relying on a twin, check whether readings are time-stamped, location-aware, and calibrated. A faulty probe can make a dry patch look wetter than it is, while a sensor installed at the wrong depth can distort the picture. Begin with a manageable pilot: one field, a few representative management zones, and a clear decision such as when to irrigate. Strong data discipline is more valuable than a complicated model fed by inconsistent measurements.
Practical tip: Record the action taken after each alert. Those decisions create a useful history for comparing predictions with what actually happened.
Simulating soil moisture and irrigation choices
Soil moisture is one of the clearest uses for a field twin because it changes continuously and directly affects crop stress. The model can combine recent rainfall, irrigation records, soil texture, crop growth stage, forecast weather, and measured moisture. You can then compare scenarios such as irrigating today, waiting two days, or applying water only to a dry management zone.
Imagine a corn field with sandy soil on a higher section and heavier soil near a lower boundary. A single irrigation schedule may overwater the lower section while leaving the sandy area short of water. A twin can represent those zones separately and estimate how quickly moisture will decline under forecast heat. The result is not a guarantee; it is a structured comparison that makes the trade-off visible.
To make the simulation useful, define thresholds that match the crop and growth stage rather than using one permanent number. Also account for uncertainty. Forecast rain may not arrive evenly, and a probe represents a small point rather than every square meter around it. Use the prediction to target scouting and confirm conditions in the field before committing to a large change.
Tracking crop health before symptoms spread
Crop-health simulations bring together measurements that are easy to interpret separately but more useful when viewed over time. A twin can compare current canopy imagery with earlier observations, weather stress, soil moisture, planting density, and field operations. Instead of waiting for an entire block to look visibly weak, you can investigate a small area where several signals are moving in the wrong direction.
For example, a crop zone with declining vegetation indicators, low moisture, and unusually high afternoon temperatures deserves a different response from a zone with low vegetation indicators but adequate water. The first may call for irrigation checks and scouting for stress. The second could point to emergence problems, compaction, pests, disease, or a measurement error. The model narrows the question; it does not identify the cause by itself.
Set a routine for validating alerts. Walk a sample of flagged locations, photograph the plants, inspect roots or leaves where appropriate, and note recent machinery activity. Those observations help distinguish a real pattern from a bad reading. Over several seasons, the combination of predicted risk and verified field notes can make the twin more useful for timing scouting and prioritizing limited labor.
Testing fertilizer efficiency before application
Fertilizer decisions are a strong case for scenario testing because both underapplication and overapplication can be costly. A digital twin can compare a planned rate with crop demand, soil-test results, yield goals, previous applications, weather, and expected nutrient movement. It may help you divide a field into zones instead of applying one rate everywhere.
Consider a field where one area has a history of strong yields and another has drainage limitations. Applying the same nitrogen rate across both areas may not produce the same result. A simulation can examine different rates, timing, or placement while accounting for the possibility of rainfall after application. It can also show where an intervention is unlikely to change the outcome, which is valuable when input costs are rising.
Do not treat a model’s estimated nutrient response as a substitute for soil testing, label requirements, agronomic advice, or local environmental rules. Fertilizer movement depends on conditions the twin may not fully observe. Use simulations to frame a testable plan, then compare predicted crop response with tissue tests, scouting, harvest records, and residual nutrient measurements. That feedback is how efficiency improves without turning the field into a one-time experiment.
Making a digital twin useful on the farm
The best deployment is usually narrower than the technology’s full promise. Start with one operational question, such as reducing unnecessary irrigation passes or finding zones that need a closer nutrient review. Establish a baseline for water use, input rates, crop condition, and yield. Then run the twin alongside current practice long enough to compare decisions under different weather and growth conditions.
Give someone clear responsibility for checking data quality, reviewing alerts, and recording what happened next. Farmers should be able to see why a model produced a recommendation, which measurements influenced it, and how uncertain the result is. A black-box alert that cannot be challenged will quickly lose credibility, especially when field conditions change faster than the model updates.
Also plan for connectivity gaps, sensor maintenance, data ownership, and system integration. A remote field may not transmit continuously, and an old equipment record may use different units or boundaries. Keep a manual fallback for irrigation and scouting. The next step is simple: choose one field and one decision, install or audit the needed data sources, define success in measurable terms, and review predicted versus observed results at the end of the season.
Frequently asked questions
It is a digital representation of a field that combines physical characteristics and management history with live or regularly updated data from sensors, imagery, weather services, and farm equipment. It can be used to monitor conditions and compare possible actions.
It can estimate risk or likely changes by combining signals such as soil moisture, weather, canopy imagery, and crop stage. Predictions still need field verification because pests, disease, sensor errors, and unmeasured conditions can produce similar patterns.
It can compare application rates, timing, and management zones against soil tests, crop demand, weather, and past field results. This may help target inputs, but it does not replace agronomic guidance, testing, label directions, or local regulations.
Choose a specific decision to improve, audit available data, verify sensor placement and calibration, establish baseline measurements, and run a limited pilot. Compare predictions with field observations before expanding the system.
Related reading
Related reading
Enjoyed this read?
Like, share, or comment below.


Comments
0Sign in required · respectful discussion · replies supported
Loading comments…