

Why Microclimates Matter More Than the Forecast
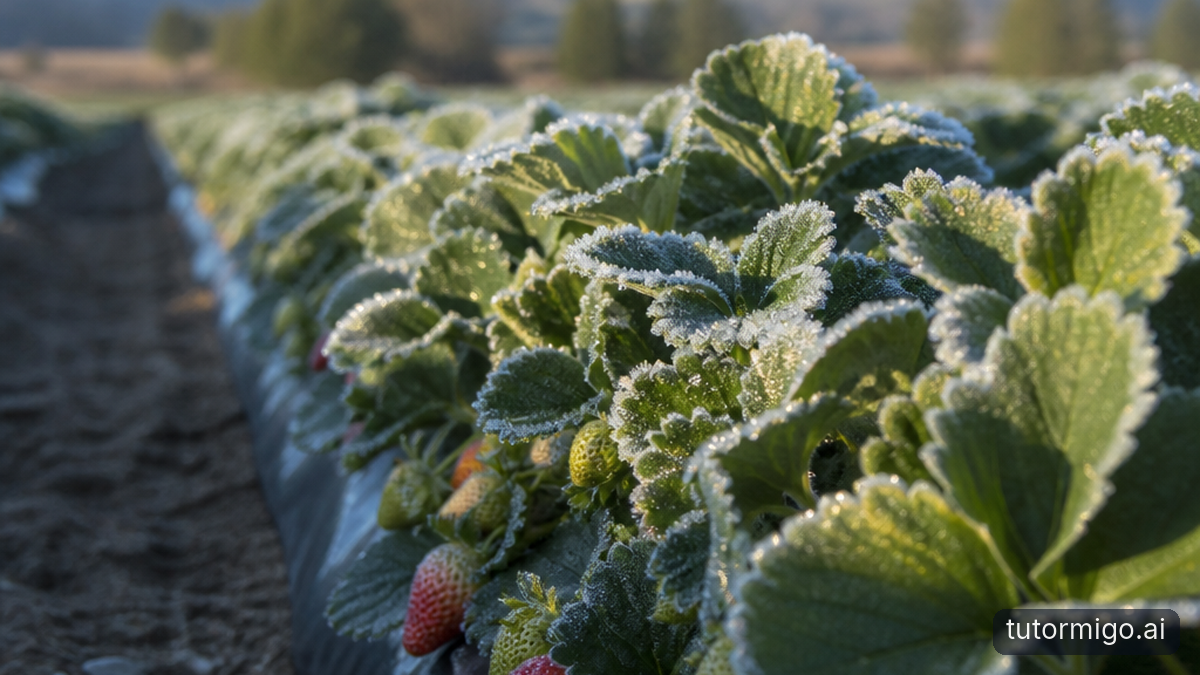
A regional forecast can say the temperature will reach 35°C, yet plants across one greenhouse or field may experience very different conditions. A crop beside a closed wall may sit in still, humid air while another row receives strong sunlight and dries rapidly. For high-value crops such as berries, tomatoes, peppers, leafy greens, and flowers, those small differences can determine whether a harvest meets its quality target.
Microclimate simulation turns those hidden differences into a map. Instead of treating a growing area as one uniform box, you can examine air temperature, humidity, wind speed, solar load, and leaf wetness at many locations. A model might show that hot air collects above a dense canopy, or that a low section of an open field remains cold after sunrise.
The practical goal is not a perfect forecast months in advance. It is earlier, more localized warning. If a model predicts that humidity will stay high around cucumber leaves overnight, you can adjust ventilation before fungal disease becomes likely. If it predicts a frost pocket near a field boundary, you can prioritize that zone for covers, sprinklers, or heaters.
How CFD Reconstructs Airflow in a Greenhouse
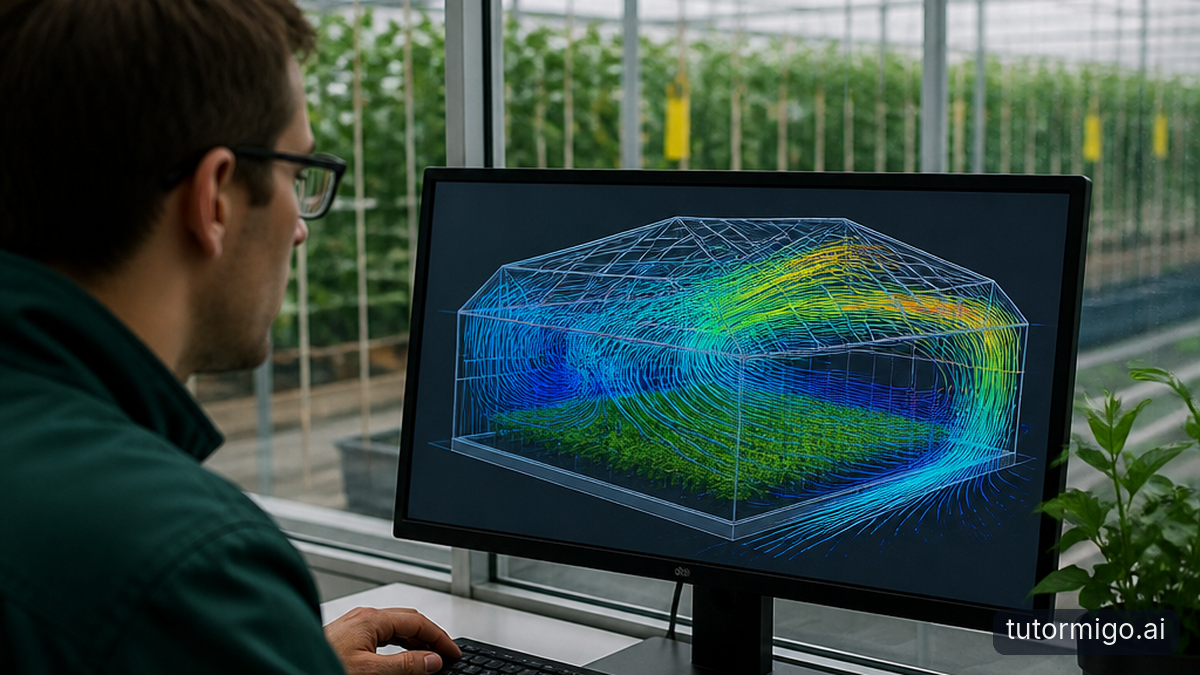
Computational fluid dynamics, or CFD, divides a greenhouse into thousands or millions of small cells. It then estimates how air, heat, and moisture move between those cells. The calculations account for features such as roof vents, circulation fans, heating pipes, screens, benches, crop rows, and the greenhouse envelope. A simplified airflow model solves conservation equations for mass, momentum, and energy, often represented by variables such as velocity , pressure , temperature , and density .
Consider a winter greenhouse with heating pipes along one wall and a vent near the roof. Warm air rises, cooler air falls, and the vent can create a circulating loop. CFD can reveal whether that loop reaches the far crop rows or leaves cold, stagnant pockets near the floor. The same model can test alternative fan positions without physically rebuilding the structure.
Accuracy depends on the inputs. Operators need reliable dimensions, vent settings, fan performance, outside weather data, and crop geometry. A dense mature canopy behaves differently from newly planted rows because it changes resistance to airflow and releases more moisture. Field measurements from temperature and humidity sensors are essential for checking whether the simulated pattern matches reality.
Using AI to Predict Rapid Microclimate Shifts
CFD is powerful, but running a detailed simulation for every possible weather sequence can be too slow for real-time decisions. AI models help by learning relationships between sensor readings, weather forecasts, crop conditions, and previous simulation results. Once trained, a model can estimate how a greenhouse or field will respond to an approaching heat wave in seconds rather than hours.
A useful system may combine outside temperature, wind direction, cloud cover, radiation, soil moisture, vent position, irrigation, and internal sensor readings. It can then predict conditions at specific points, such as canopy temperature two hours after sunrise or relative humidity near a north-facing wall. The model may also flag unusual behavior, such as a fan operating normally while airflow remains below its expected range.
AI should not be treated as an unexplained answer. Growers need uncertainty ranges and clear explanations of which measurements drove a prediction. A forecast that says humidity will rise to 92% with a likely range of 88% to 95% supports a different decision from one that gives a single precise number. Hybrid systems are often strongest: physics-based CFD describes airflow, while machine learning corrects recurring errors caused by complex crop growth or imperfect sensors.
Simulating Extreme Heat, Frost, Wind, and Storms
Extreme-weather simulations are most useful when they test specific decisions. For heat, a model can compare open vents, shade screens, evaporative cooling, and altered irrigation timing. It may show that roof vents reduce average temperature but leave the center canopy too hot because incoming air bypasses that zone. In an open field, the model can identify where reflective ground cover or temporary shade would provide the greatest benefit.
Frost requires a different approach. Cold air can drain into low areas overnight, especially when skies are clear and wind is weak. A field model can combine terrain, soil heat, crop height, and wind exposure to estimate where temperatures will fall fastest. That information helps you place sensors and deploy protection where it matters most instead of treating every acre identically.
Wind simulations can test whether a greenhouse frame, trellis, or windbreak creates dangerous turbulence. Storm scenarios can also estimate rain entry through vents and the risk of prolonged leaf wetness. Models do not eliminate uncertainty during rapidly changing weather, but they let you compare actions before conditions become hazardous. The most valuable output is often a ranked list of vulnerable zones and practical interventions.
Turning Model Outputs Into Crop Decisions
A simulation becomes operational only when its outputs connect to thresholds and actions. For a sensitive crop, you might define a heat alert when canopy temperature exceeds a chosen limit for a sustained period, a humidity alert when condensation is likely overnight, and a wind alert when gusts threaten stems or coverings. The exact values depend on the cultivar, growth stage, structure, and local management plan.
Suppose a greenhouse model predicts that the western rows will exceed the heat threshold at 2 p.m. while the eastern rows remain within range. You could deploy shade cloth over the western section, increase circulation there, or shift irrigation earlier so roots are hydrated before peak demand. If the model predicts cold air settling over one corner of an outdoor berry field, you could place frost protection equipment and a confirming sensor in that location.
Keep the response proportional to the confidence of the prediction. A high-confidence warning supported by several sensors may justify immediate intervention. A low-confidence alert may call for a targeted inspection first. Record the predicted conditions, the action taken, and the observed result. Those records improve future calibration and reveal which interventions protect quality without wasting water, energy, or labor.
Building a Reliable Microclimate Modeling Program
Start with the crop zones where weather damage is most expensive. You do not need a perfect digital replica of an entire operation on the first day. Map the greenhouse or field, identify likely hot, cold, wet, and windy spots, and install sensors that capture those contrasts. A small number of well-placed instruments is more useful than many sensors clustered in one convenient location.
Next, calibrate the model through ordinary weather as well as extreme events. Compare predicted and observed temperature, humidity, wind, and leaf wetness at different times of day. Check whether errors increase when vents open, the canopy becomes denser, or irrigation changes. Update the geometry and operating assumptions as the crop grows; a model based on young plants may misrepresent airflow through a mature canopy.
Finally, define who receives alerts and what happens next. A warning that arrives without a responsible operator or a practical response is just another data point. Review performance after heat waves, frost nights, and storms. The best system combines CFD for detailed physical understanding, AI for fast and adaptive prediction, and experienced growers who can judge whether a recommended action fits the crop, infrastructure, and available resources.
Frequently asked questions
A microclimate is the set of temperature, humidity, airflow, radiation, and moisture conditions in a small area, such as one greenhouse zone or a low section of a field. It can differ substantially from the regional weather report.
CFD models airflow, heat, and moisture movement around vents, fans, heating systems, screens, structures, and crop rows. It can identify stagnant, overheated, overly humid, or cold areas before they cause crop damage.
No. AI predictions depend on reliable sensor and weather data, while grower judgment supplies crop knowledge and practical context. The strongest systems combine sensors, physics-based models, machine learning, and human review.
Begin with the zones and weather events associated with the greatest financial risk, such as heat in a greenhouse, frost in a low field area, or wind near a vulnerable structure. Use targeted sensors to validate the initial model.
Enjoyed this read?
Like, share, or comment below.


Comments
0Sign in required · respectful discussion · replies supported
Loading comments…